


What is Grafana?
Grafana is a popular open-source analytics and interactive visualization web application designed for monitoring and visualizing data and creating interactive dashboards. It allows you to query data and build graphs, charts, and dashboards of the data (metrics & logs) from various supported data sources, making it easier to interpret and understand the data.
Prerequisites
This is a practical demonstration will show you how to install Grafana on Ubuntu 22.04 with practical examples, and to follow along, make sure you have:
An Ubuntu server
A non-root user with sudo access
How to Install Grafana on Ubuntu 22.04: Step-by-step process
This section provides step-by-step instructions on how to install Grafana on Ubuntu 22.04 using the official APT repository.
Step 1 - Update and upgrade
First, you want to make sure your system's packages are up to date. You can do that by running the following command in your terminal:
sudo apt update -y && sudo apt upgrade -y
Step 2 - Install the required packages
Next, run the following command to install the packages needed for the installation:
sudo apt install -y apt-transport-https software-properties-common wget
Step 3 - Add the Grafana GPG key
Next, download and store the Grafana GPG key with the following commands:
sudo mkdir -p /etc/apt/keyrings/
wget -q -O - https://apt.grafana.com/gpg.key | gpg --dearmor | sudo tee /etc/apt/keyrings/grafana.gpg > /dev/null
The first command creates a directory where the key will be stored. The second command will download, convert, and store the key in the specified location for secure APT package management.
Step 4 - Add Grafana APT repository
The Grafana package is not included in the default Ubuntu repositories by default. To install Grafana, you'll need to add the Grafana official APT repository to your system's APT sources. This will enable your system to recognize and retrieve Grafana packages during the installation process.
echo "deb [signed-by=/etc/apt/keyrings/grafana.gpg] https://apt.grafana.com stable main" | sudo tee -a /etc/apt/sources.list.d/grafana.list
After adding the repository to your system, update the package index to include information from the newly added repository using:
sudo apt update
Step 5 - Install Grafana
Now install Grafana using:
sudo apt install grafana
Step 6 - Start the Grafana service
Once the Grafana installation process has been completed, you can verify the version using:
sudo grafana-server -v
Next, start the Grafana service and enable it to start automatically at system reboot using the following commands:
sudo systemctl start grafana-server
sudo systemctl enable grafana-server
Step 7 - Verify that the Grafana service is running
Now verify that the Grafana service is active by running the command below:
sudo systemctl status grafana-server
If the Grafana service was started successfully, you should see a sign that it is active and running.
Step 8 - Open the port in the firewall
Port 3000 is Grafana's default port for its web interface. To allow external access to Grafana, you must enable the firewall and open port 3000. To do this, execute the following commands in your terminal:
sudo ufw enable
sudo ufw allow ssh
sudo ufw allow 3000/tcp
Step 9 - Access the Grafana web interface
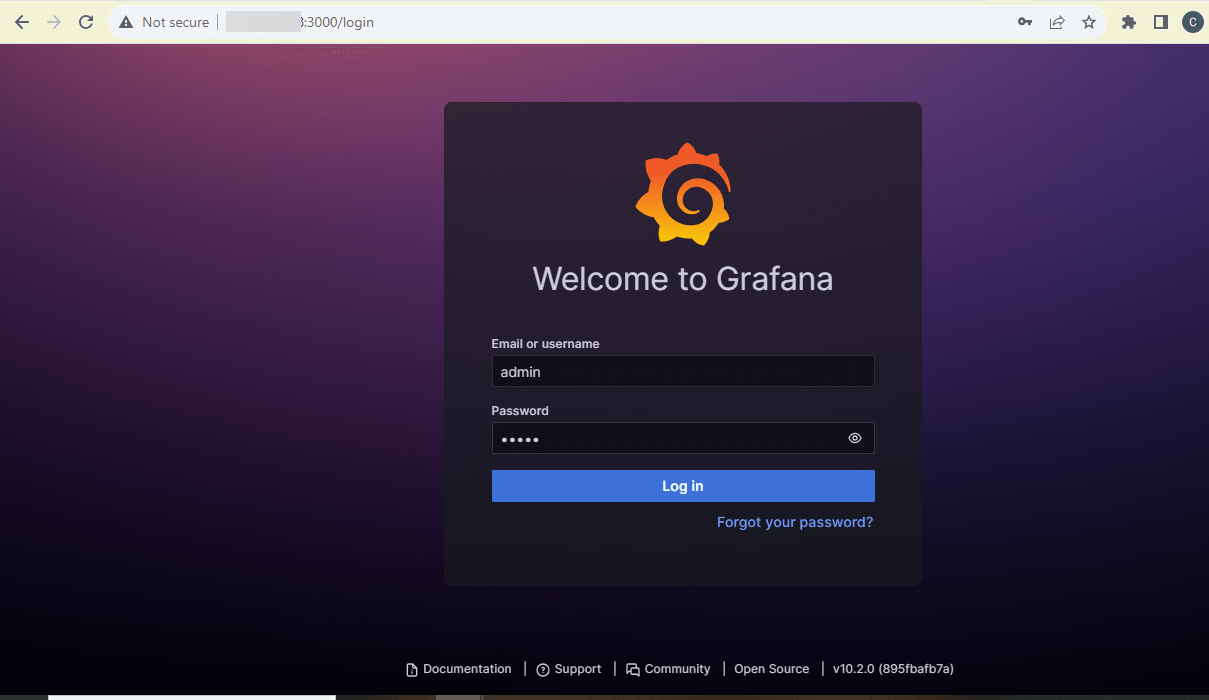
To access the Grafana web interface, open a web browser and enter the IP address of your server (or hostname if applicable), followed by port 3000. The URL format should be http://your_server_IP:3000. Once loaded, you should see the Grafana login page. The default credentials are:
Username: admin
Password: admin
You'll be prompted to create a new password. Input a secure password, confirm it, and click the "Submit" button.
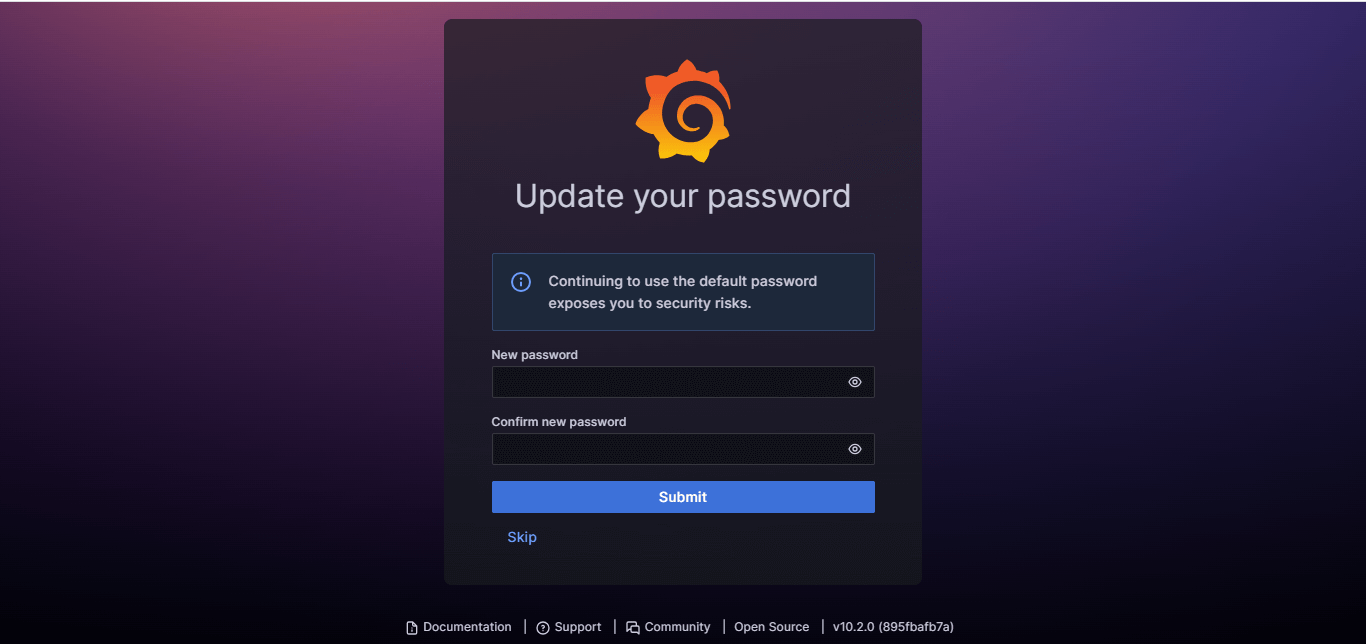
Once done, you'll have access to Grafana's dashboard.
Secure Grafana
You can secure your data using an SSL certificate. It will encrypt your connection to and from Grafana. You need to reconfigure Nginx as a reverse proxy for Grafana to make use of this connection.
Now, open the Nginx configuration file that you created earlier in the Prerequisites to set up the Nginx Server Block. We'll use nano here, you can use the text editor to make changes.
sudo nano /etc/nginx/sites-available/your_domain
Locate the following block in/etc/nginx/sites-available/your_domain.
...
    location / {
        try_files $uri $uri/ =404;
    }
...
Since you have already configured Nginx to communicate over SSL and as all the web traffic to your server already passes through Nginx, you just need to configure Nginx in a way that it forwards all requests to Grafana. By default, Grafana runs on port 3000.
Now, you need to delete the existing try_files line in this location block and instead, place it with the following proxy_pass option in /etc/nginx/sites-available/your_domain.
...
    location / {
        proxy_pass http://localhost:3000;
    }
...
Now, this will map the proxy to an appropriate port. After this, save and close the file by pressing CTRL+X, followed by Y and then ENTER if you’re using nano.
Now, test the new settings to be assured that everything is configured correctly.
sudo nginx -t
You will receive the following output:
Output
nginx: the configuration file /etc/nginx/nginx.conf syntax is ok
nginx: configuration file /etc/nginx/nginx.conf test is successful
After that, you can activate the changes by reloading Nginx.
sudo systemctl reload nginx
You will now be able to access the default Grafana login screen by directing your web browser to https://your_domain. In case you’re facing issues in reaching to Grafana, make sure the firewall is set to allow traffic on port 443 and then re-trace the previous instructions.
Since the connection to Grafana is encrypted, you can now implement additional security measures, beginning by changing the default administrative credential of Grafana.